When the
results of quantum chemistry computations are directly compared with
experiment, often quite poor agreement is obtained. However, this agreement
often becomes much better, if a series of homologues is taken and a correlation
is built between the computed and experimental values. Here I present some samples
of such correlations:
1)
Correlation
between QC (T1(1)) and experimental heat of formation for a set of 1800 diverse
organic molecules from NIST thermochemical database (from Wikipedia):

The mean
absolute and RMS errors are 8.5 and 11.5 kJ/mol, respectively.
2) Correlation
between computed and experimental NMR spectra.
We have found
that usually the computed NMR chemical shifts are rather far from the
experimental ones; maybe the physical meaning of the chemical shifts is not
clear enough. At the same time, the computed values correlate well with the
experimental ones
a) Such
correlation for several Shiff bases:


The calculations were performed with B3LYP/6-311G(D,P) method, but the B3LYP functional is considered obsolete at the moment. You should better use PBE, wB97XD or B3LYP-D3 instead. 6-311 G is not a good basis set too, you should better use, e.g., cc-pVDZ.
b) A bodipy molecule:
b) A bodipy molecule:


A similar
correlation can be obtained for H1 chemical shifts (several bodipy molecules):


I have
found that a good correlation is usually obtained for C13 chemical shifts; for
H1 chemical shifts the correlation is rather good too, but only for hydrogen
atoms attached to carbons.
c) One more correlation from this site:
http://cheshirenmr.info/

c) One more correlation from this site:
http://cheshirenmr.info/
3) An
important correlation can be obtained between computed energies, or maybe Gibbs
energies, and experimental reaction constants.
a) Here is
one such correlation for a set of 9 carboxylic acids:


Computed energies of deprotonation vs experimental pKa
The
energies were computed at PCM wB97XD/6-311++G(DP) level (the solvent is water),
with two water molecules added to the model for taking into account the
specific solvation.
The
correlation between QC energies and experimental reaction constants is based on
the assumption that the entropy contribution to the Gibbs energy within a row
of compounds is small relative to the energy contribution (if not, one can
compute the Gibbs energies as well).


The difference between  and
and  within a row of homologues is relatively small, so
and within a row of homologues is relatively small, so
b) Some
more correlations between the energy and PKa for 5 sets of compounds, taken from
paper [1]:

The
theoretical constants were calculated from the Gibbs energies of deprotonation
computed at PCM B3LYP/6-311+G(d,p) level (the solvent was DMSO).
3) One more correlation between the calculated and experimental pKa valiues [10]:

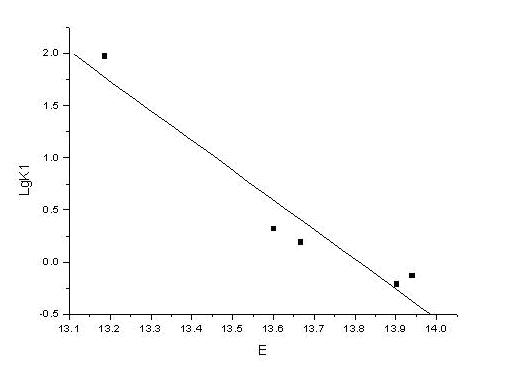
4) A
similar correlation can be obtained between the computed energies and
experimental rate constants. Here are some samples from our work:
a)
We have studied the reaction of C-Cl bond
elimination of some anion radicals:

....
The computed energies of the C-Cl bonds correlate with the experimental rate constants of the bond elimination reaction:

b)
We have studied the reaction of substitution of
alcohol ligands by imidazole using QC and experimental methods:

Apart from methanol, the data for other
alcohols were also obtained:

The alcohol substitution was studied using
electronic spectra. The experiment showed that this reaction has two stages,
each stage having its own rate constant. Then I computed the energies
Cr-Alcohol, and plotted the graph “Computed energies vs. experimental constants
of correlation (first stage)”:
Note that
in both cases no solvation modeling was used; this means that if we investigate
the tendency within a series of homologues, the accuracy of a simple quantum
chemistry computation (gas phase modeling) is sufficient to make important
conclusions.
5) We have found a correlation between the computed and experimental components of polarizability tensor for some Shiff bases:

6) For computation of electronic spectra using the TDDFT method, the correlation seems to be worse:
a) [2]:


c) [4]:

d) [7]

FIG. 7. Accuracy plots for TDDFT calculated excitation energies for metaGGAs: (a) VS98, (b) PKZB, (c) TPSS, (d) M06-L, (e) TPSSm, (f) revTPSS, (g) TPSSh, (h) M05, (j) M06, (k) M06-2X, (l) M06-HF, (m) M08-HX, and (n) M08-SO. Points above the line indicate positive errors while points below the line indicate negative errors.
e) [8]

f) For some Bodipy molecules, the correlation seems to be better [9]:

7) Here is
the correlation between computed and experimental collision diameters of some
molecules (mostly organic):

The
experimental collision diameters were taken from [5,6]. The computed ones were
obtained with Chemcraft: firstly the molecular geometries were obtained at
B3LYP/6-31G(D,P) level (again, we don’t recommend using this method, we just don’t
want to repeat the jobs with another level of theory), and then the diameters
were computed by Chemcraft via “Tools/Calculate collision diameters” menu item.
8) The
following graph should not be called a “correlation”, but it illustrates some
practical use of quantum chemistry. The X values correspond to the anisotropy
of molecular polarizability of some nematic liquid crystals (Shiff bases), the
Y values correspond to the temperatures of phase transitions (nematic-isotrope).
The first ones were computed with DFT, the latter (experimental values) were
taken from literature:

The symbols above the points represent fragments of molecules which vary among series.
This correlation is so poor not because the computation give wrong results; as it can be seen above, the computed components of molecular polarizability correlate well with experimental ones. So, the reason of such bad correlation is the imperfection of this approach (that the thermal stability of liquid crystal depends on their molecular polarizability).
This correlation is so poor not because the computation give wrong results; as it can be seen above, the computed components of molecular polarizability correlate well with experimental ones. So, the reason of such bad correlation is the imperfection of this approach (that the thermal stability of liquid crystal depends on their molecular polarizability).
9)
Vibrational frequencies
We have
computed the vibrational spectra of some simple organic compounds (toluene,
propene, acetone, benzoic acid, etc) using wB97XD/aug-cc-pVTZ method, and
compared the mode frequencies with the experimental values:

The blue
line indicates full theory/experiment match. Some improper attribution of the
bands is possible.
We have
also computed the same frequencies at a lower level (wB97XD/6-31G(D,P)). The
standard deviation turned out to be 29 cm-1 for wB97XD/6-31G(D,P) and 24 cm-1
for wB97XD/aug-cc-pVTZ. The job CPU time with the latter method was 50-100
times higher than with the former method.
When we need to interpret the experimental IR spectra, we usually compute the spectra at
wB97XD/6-31G(D,P) level of theory, and multiply the computed frequency values (X values) in Chemcraft by the coefficient of 0.958. The errors of frequencies obtained in such a way are usually not bigger than 60 cm-1.
Refs:
[1] Sergey
L. Khursana and Mikhail Yu. Ovchinnikova. The pKa theoretical estimation of
C―H, N―H, O―H and S―H acids in dimethylsulfoxide solution. Journal of physical
organic chemistry, 9/24/2014, DOI 10.1002/poc.3371.
[2] Nesrin Tokay, Zeynel Seferoğlu, Cemil Öğretir and Nermin Ertan. Quantum chemical studies on the structures of some heterocyclic azo disperse dyes.ARKIVOC 2008 (xv) 9-20
[3] S. Kawauchi, L. Antonov, Y. Okuno. Prediction of the color of dyes by using time-dependent density functional theory (TD-DFT). Bulgarian Chemical Communications, Volume 46, Special Issue A (pp. 228 – 237) 2014.
[4] Denis Jacquemin, Eric A. Perpe`te, Gustavo E. Scuseria, Ilaria Ciofini, and Carlo Adamo. TD-DFT Performance for the Visible Absorption Spectra of Organic Dyes: Conventional versus Long-Range Hybrids. J. Chem. Theory Comput. 2008, 4, 123-135
[5] H.
Wang, M. Frenklach, Combust. Flame 96, 163 (1994)
[6] R.J.
Kee et al.Chemkin Collection, Release 3.6, Reaction design, Inc., San Diego, CA
(2000)
[7]Sarom S. Leang, Federico Zahariev, and Mark S. Gordon.THE JOURNAL OF CHEMICAL PHYSICS 136, 104101 (2012).
[8] K. Okuno et al. J.Photochem.Photobiol A: Chemistry 235 (2012) 29– 34
[9] J. Chem. Theory Comput. 2014, 10, 4574−4582
[10] Bishnu Thapa, and H. Bernhard Schlegel. Improved pKa Prediction of Substituted Alcohols, Phenols and Hydroperoxides in Aqueous Medium Using DFT and a Cluster-Continuum Solvation Model. J. Phys. Chem. A, Just Accepted Manuscript • Publication Date (Web): 31 May 2017
I would disagree that B3LYP is obsolete. You only have to look at the WoS citations with this functional. It is the "default" go-to density functional for most unexperienced practitioners of computational chemistry.
ОтветитьУдалитьIn general computational chemistry (mostly DFT) is not an exact science no matter what physicists try to tell you. Quite often you have many unknowns that you cannot control. That is why calculations must be anchored with a well known property from experiment in order to obtain useful trends.
Этот комментарий был удален автором.
ОтветитьУдалить